Post-silicon debug (or post-silicon validation) is one of the important phase of the system design cycle. This is performed to capture the escaped design bugs from the pre-silicon verification phase. The major challenge associated with the post-silicon debug is the very limited observability and controllability inside the chip during the debug. Therefore, a few supporting hardware modules (known as debug structure) are inserted into the original design during the system development phase to provide enough observability and controllability during debug phase. The design of such debug structure is known as Design for Debug (DFD).
Design for Debug Infrastructure
Major components of debug structure are as follows:
- Embedded Trace Buffer (ETB)
- Trigger Unit
- Trace Bus
- Trace Port
- Debug Bus
- Debug Port
- Debugger / Debug Analyzer
- Host System
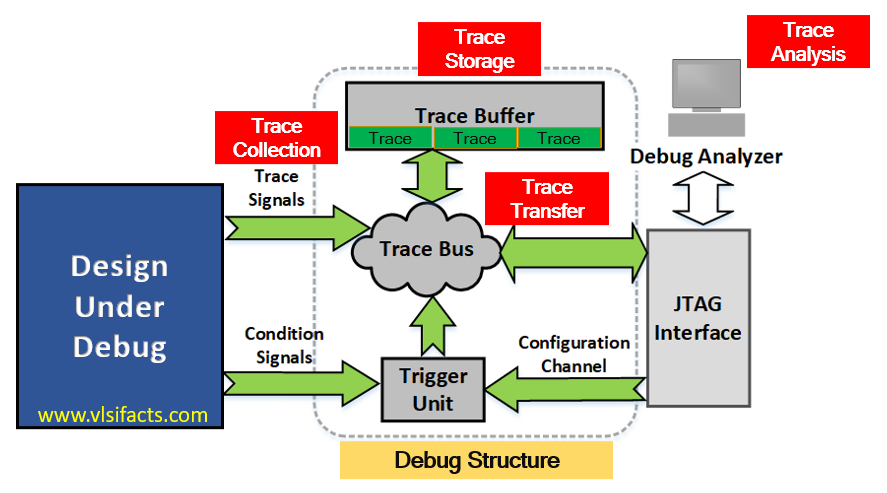
During debug phase, the design under debug (DUD) executes normal operations, and the run-time traces of the DUD’s observable points are collected. These traces are analyzed for fault detection and localization at the debug analyzer. So, let’s understand the process from the beginning.
At the beginning of the debug phase, the host system (many a time, the host system and the debug analyzer are the same) configures the trigger unit through the debug port and the debug bus. In the figure, the JTAG interface acts as the debug port, and the configuration channel acts as the debug bus. The trigger configuration is performed to instruct the conditions of triggering. This can be periodic or event-based triggering. Whenever the trigger conditions satisfy, the trigger happens, and the traces of the observable points are captured. Now, these traces can be transferred to the debug analyzer during the run-time through the trace bus and the trace port or can be stored in an embedded trace buffer (ETB) for later analysis. Many a time, the traces are not able to be transferred during run-time due to the bandwidth limitations of the trace bus as well as the trace port. Therefore, trace store and forward methodology is popularly adopted. Later, when the ETB is full, or periodically, these traces are transferred to the debug analyzer for trace analysis. The trace bus is flushed, and the new traces are collected.